Originally published in the Spring 2017 issue of Equity News.
Data Compiled By Russell Lehrer | Graphics by Nick DeSantis |Special thanks to Doug Beebe, Tom Kaub and Sherry Xu
The following pages represent a historic moment. For the first time in our 104-year history, we have the technical ability to take an empirical look at potential hiring biases within our industry.
To perform the study, we compiled new weekly employment opportunities on all contracts that began performances between Jan. 1, 2013, through Dec. 31, 2015. Weekly employment opportunities excluded per-performance contracts with no guaranteed employment. And by focusing on new employment opportunities, we analyzed the opening night casts during that window, excluding all replacement contracts as well as any shows that opened prior to 2013.
The results of this study – some two years in the making – shows that even in the year 2017 there are stark and pervasive barriers to employment in our industry for women and people of color – across all Equity contracts.
For example, we have learned that nationally over the course of 2013 to 2015, most principal contracts went to Caucasian members, accounting for 71 percent. Asian Americans: barely 2 percent. African Americans: 7.56 percent. As you’ll read on the following pages, these numbers are consistent with other contracts and opportunities offered to our members.
Equally troubling is the appearance of hiring bias when it comes to gender: Our membership is evenly divided between women and men. Consistently across all the on-stage contracts examined in this study, men were offered close to 60 percent of the on-stage contracts. For example Men were offered 61 percent of national principal contracts.
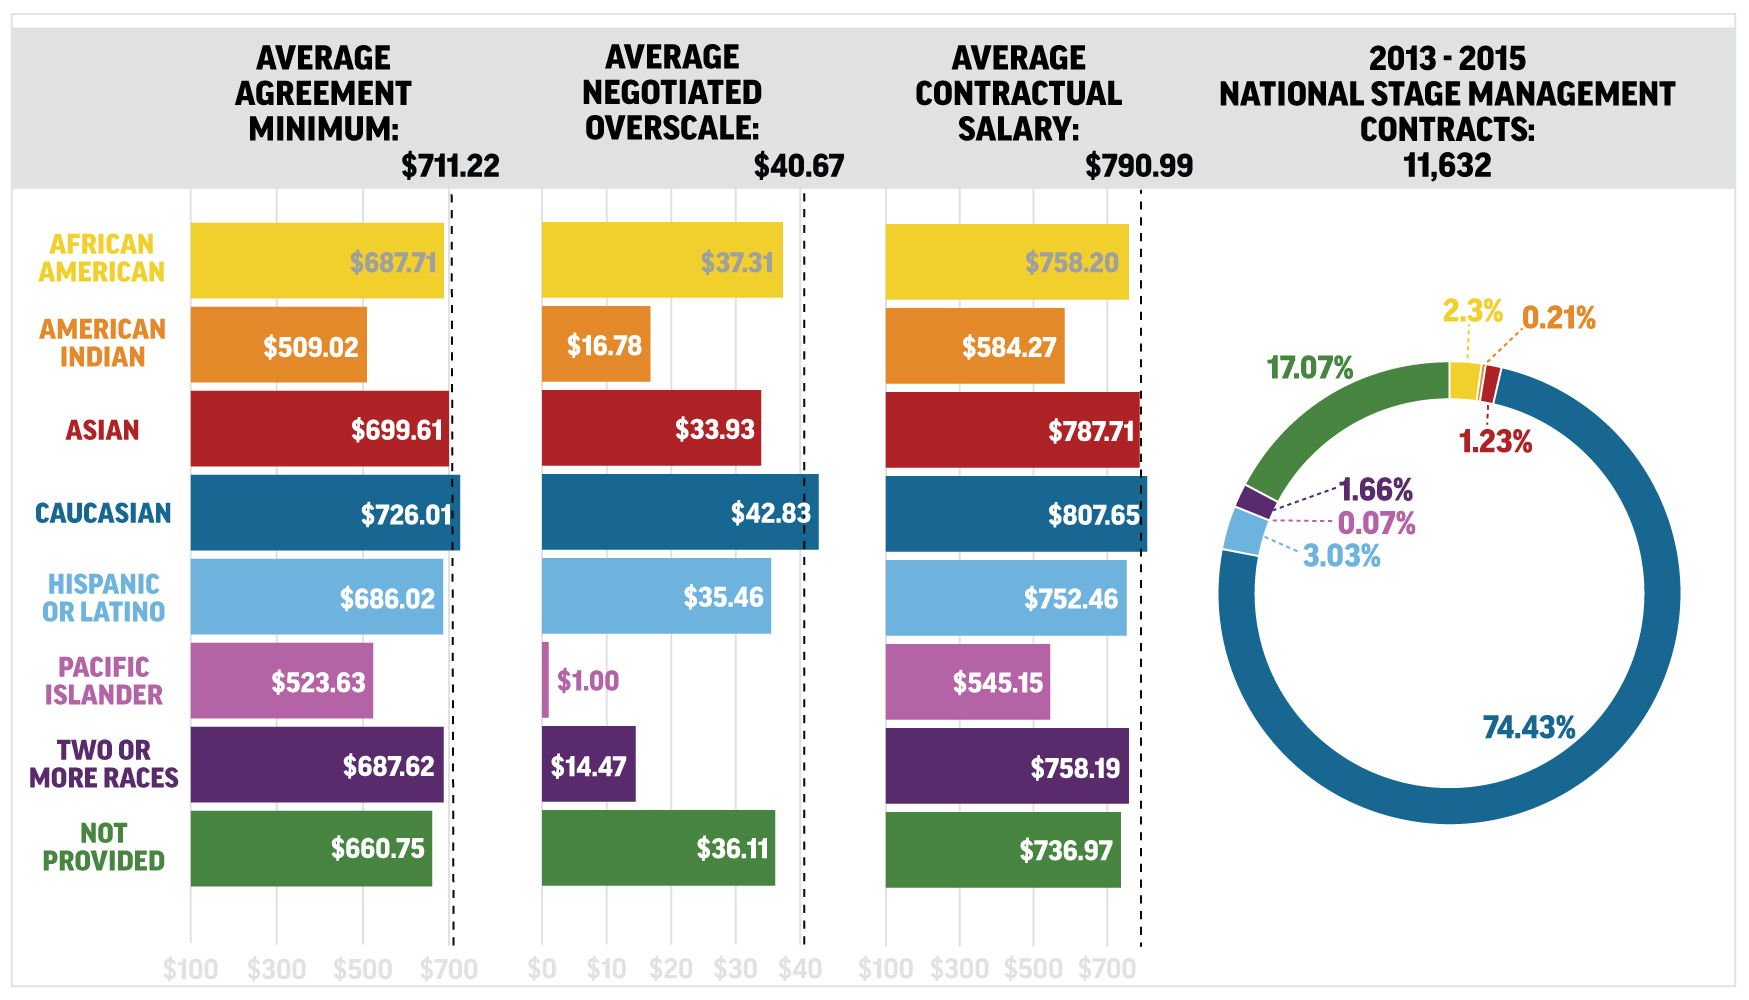
This study also shows that the problem goes beyond the stage and extends into the booth. The overwhelming majority (74 percent) of national stage management contracts went to Caucasians. In fact, stage management was the least ethnically diverse cohort in Equity’s employment categories.
While women were more likely than men to receive stage manager contracts, they reported lower earnings. Women were employed on agreements with lower minimums, negotiated lower overscales and earned lower average contractual salaries than men.
The data that follows comes in response to a resolution passed by Equity’s National Council in September 2015 and represents only highlights of Council’s report due to space limitations.
For years Equity has fought at the bargaining table to include language to improve diversity and inclusion. While this effort is important, this study demonstrates that Equity cannot solve this problem at the bargaining table alone.
This study raises questions about how we measure progress. Last season, shows like The Color Purple, Shuffle Along, On Your Feet! and Hamilton made it seem like diversity issues on Broadway were solved. But, how do we move, as an industry, to a place where there are more roles for women and people of color in all productions?
Given long-term demographic changes in our nation, this problem is one that should concern us all – how can our industry reach the nation if it doesn’t represent the nation?
The good news is that there are some signs of progress. A number of Equity theaters are taking steps to #ChangeTheStage. A few of those stories are highlighted in this report. One lesson from those stories is the need to think about diversity and inclusion across all aspects of production.
Equity is in the midst of hiring its first-ever Diversity Director, a role that will help to further Equity’s goals of inclusion and diversity both within the organization and the greater theatre community. Ultimately, this study is just the start of what needs to be an industry-wide conversation about how we can work together to #ChangeTheStage.
Throughout the study presented in Equity News, we looked at eight different employment cross-sections, nationally. We present the analysis of Principal (in both a play and musical), Chorus and Stage Manager contracts worked by our members between 2013-2015. We then applied those same three years and contract categories to the LORT Agreement. Note that all Equity membership data presented in this report reflects the union’s membership numbers as of Sept. 1, 2016.
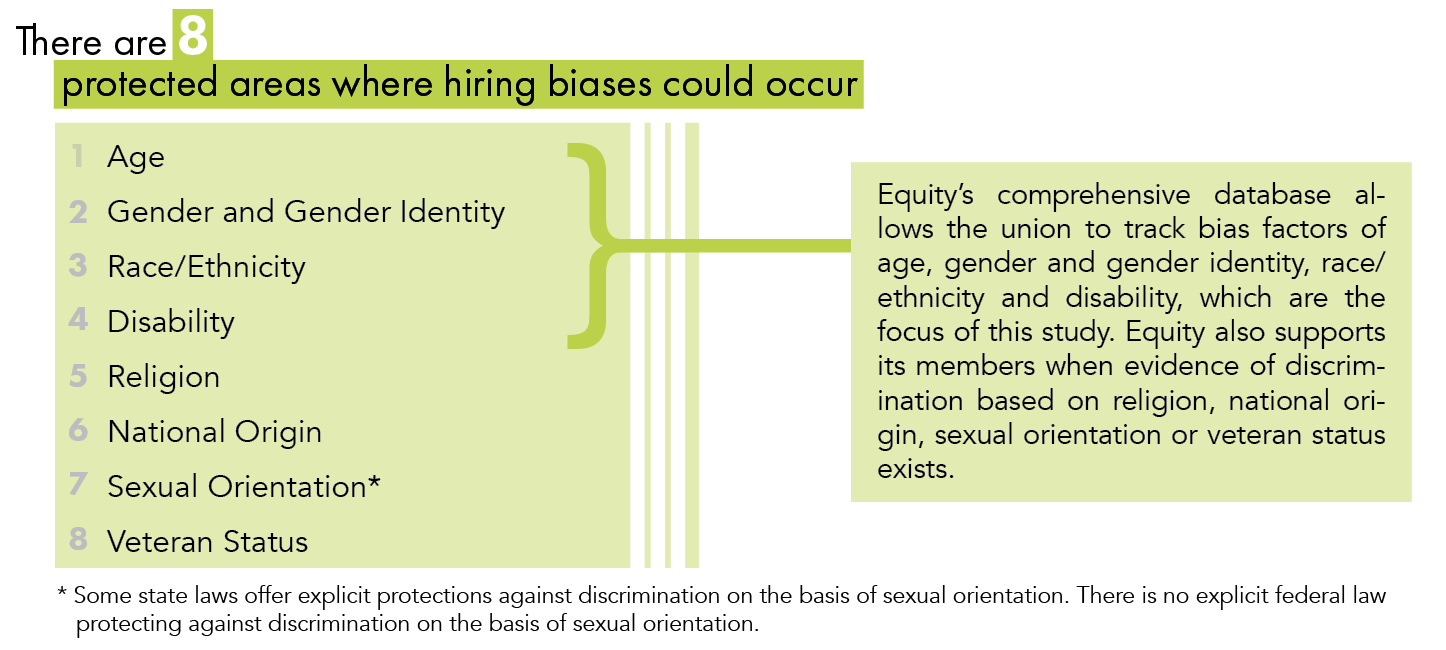
What is a hiring bias?
While an employer has a right to employ people based on many factors for which they may express a preference, there are eight legislatively protected areas where such hiring biases should never occur:
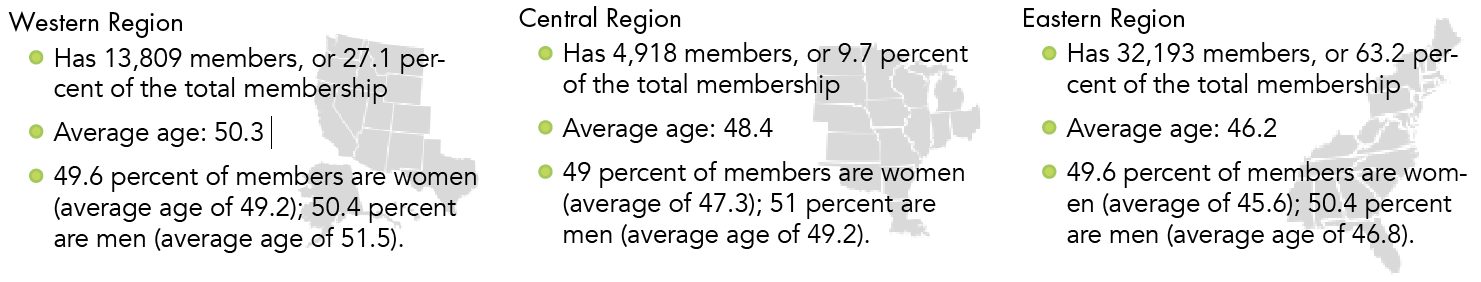
Our Membership
Like the U.S. population, which is 50.8 percent female (according to the 2010 U.S. Census), the Equity membership is almost evenly divided, female/male. Equity has historically asked its members to self-identify as either female or male, but plans to expand the options to reflect the full spectrum of our members’ gender identity.
Women represent 49.5 percent of Equity’s total membership, with an average age of 46.7 years old.
Men represent 50.5 percent of Equity’s total membership, with an average age of 48.3 years old.
Of Equity’s 50,920 members, the average age of the membership is 47.6 years old.
National Racial/Ethnic Distribution
Equity has a proud, diverse membership. Currently, we are working with the National Equal Employment Opportunity Committee to redefine and broaden our race and ethnicity self-identification options for members. The following percentages are the race/ethnicity distribution of our membership as of Sept. 1, 2016.
| 7.5% |
<0.1% |
2.2% |
68% |
| African American |
American Indian |
Asian |
Caucasian |
| |
|
|
|
| 2.5% |
0.2% |
3.6% |
16% |
| Hispanic or Latinx |
Pacific Islander |
Two of More Races |
Not Provided |
16 percent of our members choose to not self-identify their race or ethnicity. We encourage you to share this sensitive information with us so we may serve you better. Your personal information is never shared with employers.
National Disability Distribution
We are committed to expanding representation of and increasing opportunities for our diverse membership. We began asking members to self-identify as having a disability in 2012, and we are working with members of the community to expand that identification. We are aware that many members choose not to self-identify for any number of reasons. Currently only 219 members self-identify as having a disability of some kind, and we know those numbers are not representative of the actual population of our membership.
There are two ways of defining disability. Under the narrow legal definition, a disability is an impairment which prevents a person from performing tasks essential to their daily life. The broader definition includes a wider degree of impairments already included under the narrow definition (e.g. low vision, or hard of hearing), as well as other diagnoses (e.g. fibromyalgia, or HIV) which impact but do not necessarily prevent a person from performing essential tasks. If you self-identify with either of this definitions, tell us so that we can better understand the biases in your community.
Employment Opportunities
Equity typically analyzes our data in terms of work weeks; this weighs contracts by their length and is appropriate for most analysis. For this study, however, we didn’t, and for very specific reasons. We looked instead at initial work opportunities, regardless of contract length and only for new employment. In order to quantify potential bias we presented data about:
- Weekly employment opportunities | Meaning no casual or daily employment
- Shows opening during 2013-2015 | Meaning no existing or long-running employment
- Cast and salary information as of opening night | Meaning no replacement employment
It was determined that this narrowing of the work experience of our membership would give a fuller picture of the bias. The casting of one production of Gypsy, for example, running for three weeks, would be given the same weight in terms of bias as another production that runs for two years. And the initial cast of that long-running production would represent the producer’s initial choice for the roles in order to not mask bias by a more inclusive replacement casting practice (though laudable and to be encouraged).
Also not included in the report were star-salaried contracts (defined as members who negotiated $10,000 or more of overscale per week), as these numbers would not reflect the experience of the majority of the membership and would skew the data. Choosing the three complete years contained in our expanded database available at the time of the research was hoped to give as complete a picture as possible that was not tied to any one season’s specific productions to the degree possible.
During the three years studied, there were 63,603 unique, new weekly work opportunities for members, excluding star contracts. The average contractual salary for these opportunities (across all contract types and responsibilities) was $746, which included an average of $92.72 of overscale.
Examining Gender Disparities
In this study, we examined four specific contract types offered to our members nationally. We researched principal employment in plays, principal employment in musicals, chorus employment and stage management employment across the nation. From there, we took those same contract categories and applied it to those opportunities that were offered on a LORT Agreement, Equity’s second largest contract. For the Council report, all contracts were analyzed and showed that these national and LORT figures are typical and representative.
To the left is an infographic displaying the distribution of new work opportunities that went to men and women over the course of 2013-2015.
One of the important aspects we wanted to investigate was, similar to our membership, if the work was being divided evenly. It’s not. What we have discovered is that our industry is hiring more men—sometimes up to 20 percent more—than women.
In every on-stage category of employment, more than 50 percent of the contracts were offered to men. Between 2013-2015, women made up only 39.1 percent of contracts worked in principal employment in plays. For LORT contracts in the same category, women were offered 38.6 percent of the available contracts. The closest women come to equaling men on stage is in national chorus employment, with 42.9 percent compared to the 57.1 percent of the work going to men. Only in stage management do we see a reverse of this trend.
This disparity is also found in the wage gap discovered between men and women working on contracts presented in this study. Though all of our members, through our negotiations, are guaranteed the same minimum salary, the disparity is also found in the wage gap between male and female Equity members. This wage gap is because women are more frequently hired on lower paying, lower minimum contracts.
Let’s examine national stage manager employment, which demonstrates the most clear view of potential bias since the opportunities are not tied to textual influence. In the three years examined for this study (2013-2015), there were 11,632 new stage management opportunities offered to our members. As reported above, 65.9 percent went to women and 34.1 percent to men. Our data shows that while women may have had more work opportunities than men, they worked on contracts with lower average minimum salaries. And what’s more, women garnered less overscale, leaving them with a contractual salary that was lower than roughly $98.
When looking at national LORT principal in a musical employment, not only did women only represent 41.1 percent of the contracts, but women were employed on lower category contracts than men, with average minimums of $735.65 compared to $749.47. Women also negotiated slightly less overscale than men, earning contractually less than men by about $15.
In several situations, women have been able to negotiate the same average overscale, but still earn less salary — as seen in national principal in a play employment where women are earning about $10 less. When examining national LORT employment on a chorus contract, we found that not only did a majority of the work opportunity go to men, but the wage gap demonstrates disparity as well.
Possible Employment Bias
Throughout this report, we will present three key numbers, which serve as the benchmarks we look at to show evidence of hiring bias. The ability to get a contract, the minimum salary of those contracts and the ability to negotiate overscale. Please note: For this study, we considered contract minimums and overscale.
Examining Racial Disparities
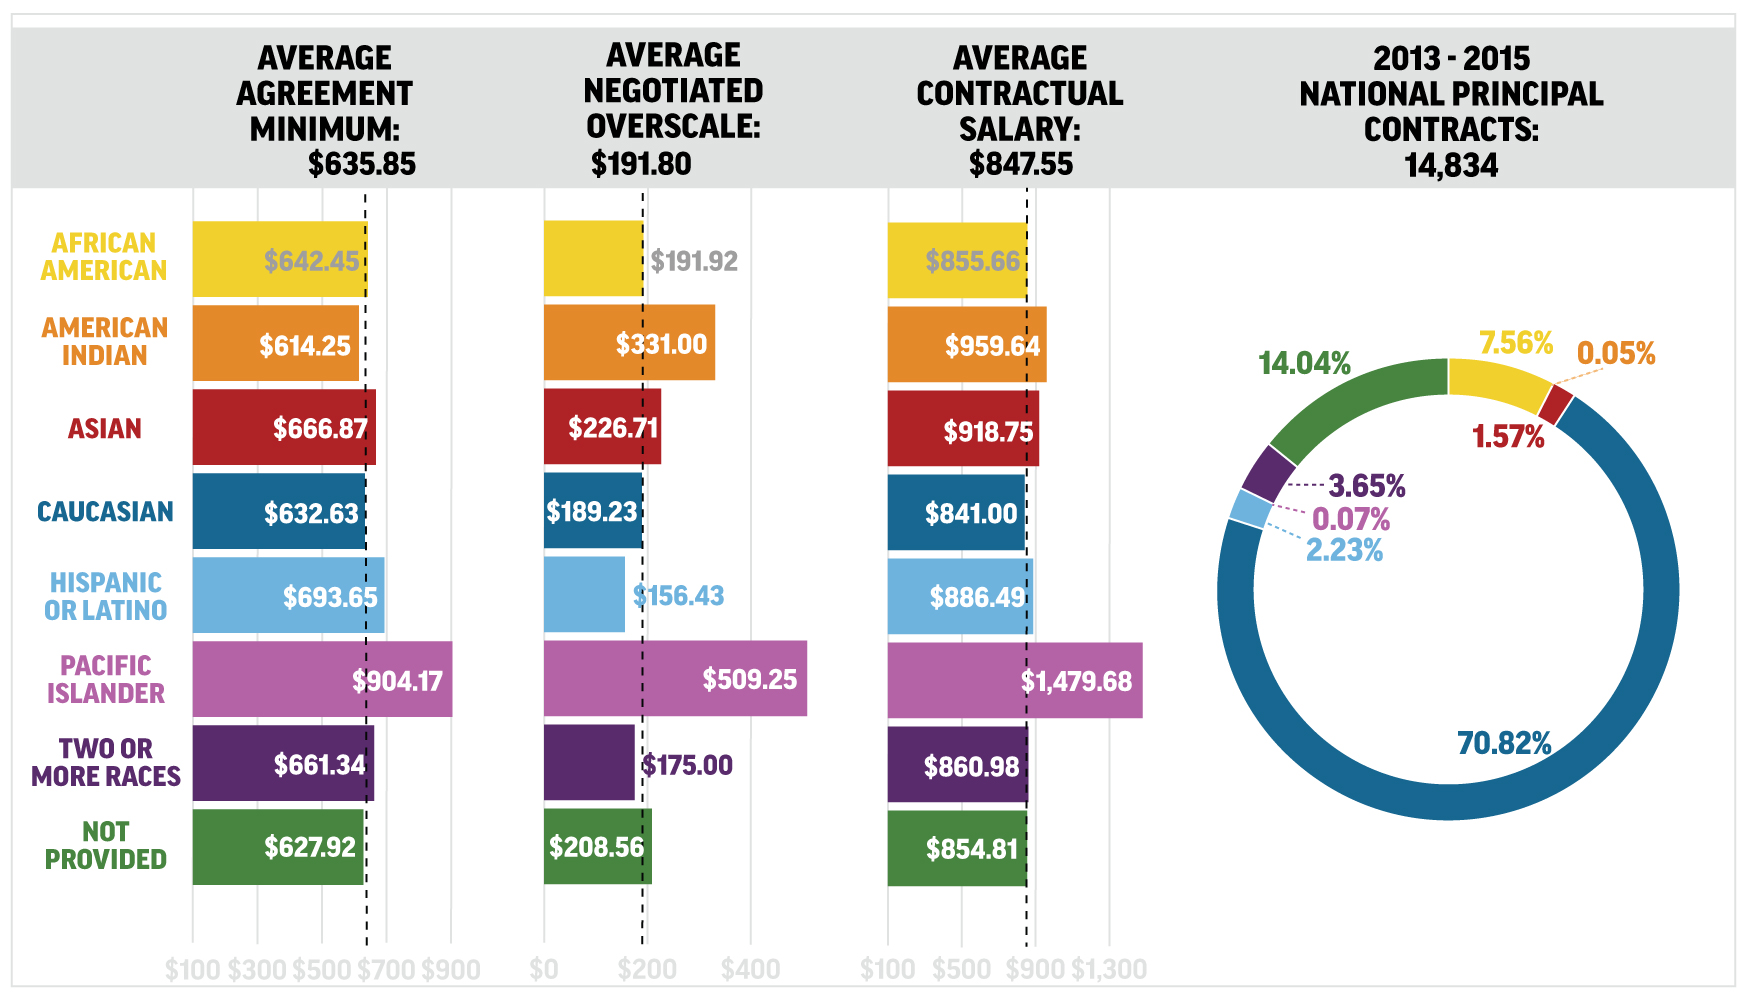
We didn’t only discover gender disparity. This study proved out an embarrassing truth within our industry: a major lack of diversity on stage. A majority of all new contract opportunities offered to Equity members went to Caucasian actors and stage managers. And as you previously read, most of the work went to Caucasian men. In some instances Caucasian members garnered over 70 percent of contracts offered, as seen in the national principal employment in musicals. In that same category, African Americans received only 7.56 percent of the work, those who identify as Hispanic or Latino had 2.23 percent of those contracts and Asian Americans received a mere 1.57 percent.
These numbers are disheartening and consistent throughout all of our research.
What’s additionally troubling, however, is what’s in the unknown. As we stated earlier in this study, 16 percent of our membership have not identified their race/ethnic background. That means, for this research, there can be anywhere up to almost 20 percent of employment in any single analysis we cannot quantify. That’s a wide margin of uncertainty that, if members identified themselves to Equity, we could quantify to help further complete this research and define the problems we face.
The following four charts display, in-depth, the amount of new work offered to members, average overscale negotiated on those contracts and the average contractual salary. Note that these graphs consider all of Equity’s available contracts, from Production to Casino to Small Professional Theatre to Bay Area Theatre Agreement. Further, the information presented contains a wide range of minimum salaries, opportunities for negotiating overscale, the possible existence of non-union performers within the production and, within any one contract type, various tiers or categories.
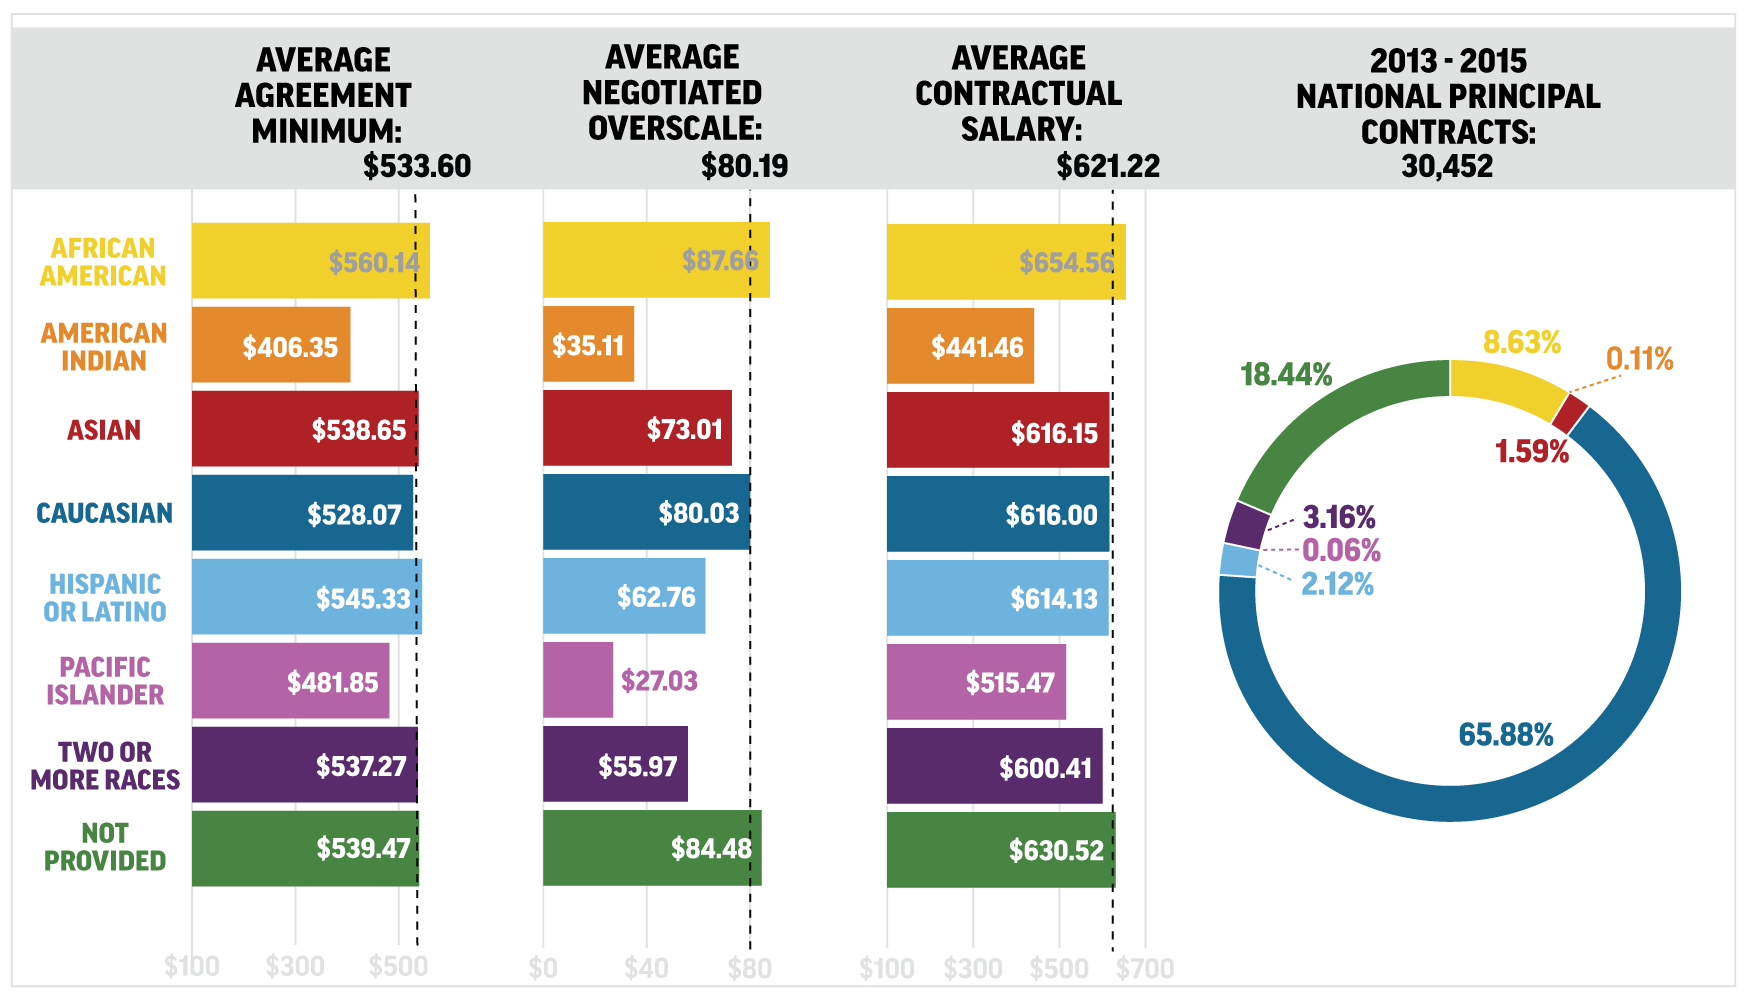
National Principal Employment in Plays
During 2013-2015, there were 30,452 unique, new work opportunities for weekly employment on a Principal Contract in plays.
National Principal Employment in Musicals
Between 2013-15, there were 14,834 new Principal Contracts offered on musicals.
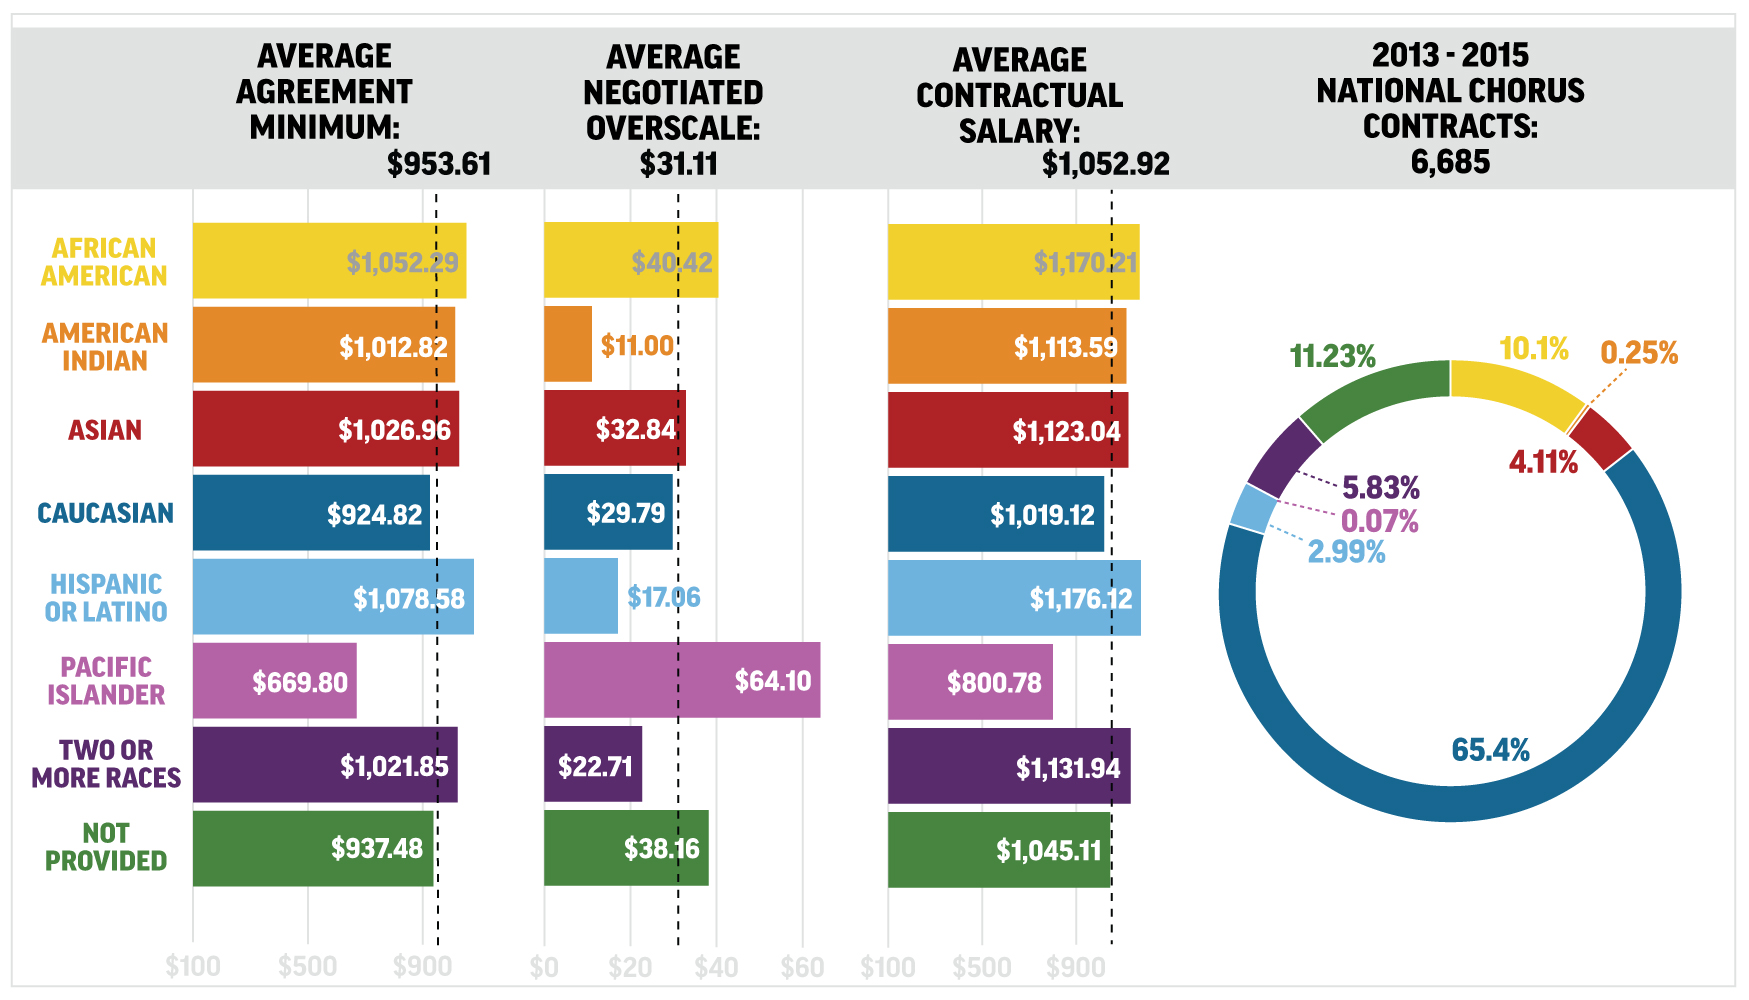
National Chorus Employment
There were 6,685 new opportunities for Chorus Contracts, spanning all contract types, between 2013-15.
National Stage Management Employment
This cross section of our membership is the least racially and ethnically diverse employment category. In the three years of this study, there were 11,632 new opportunities offered. These work opportunities include both stage managers and assistant stage managers who have different minimums and opportunities for overscale, as the principal studies included members working on the full range of available contracts below star salary.
Case Study: LORT Employment
The previous analysis contains all of our available contracts, with a wide range of minimum salaries, opportunities for negotiating overscale, the possible existence of non-Equity performers in the production and, within any one contract type, various tiers or categories as well.
In order to examine the situation within a narrower view, we conducted an analysis of the national LORT Agreement. The LORT Agreement is used across the country with its own categories and various minimums. For the majority of our membership, LORT theaters represent a sizable portion of their union careers. The following data utilizes the same template as the national numbers previously shared for comparison. But note that with smaller sample sizes, we expect and see greater variance, particularly in the racial and ethnic hiring and earning statistics, which become more dependent on seasonal influences such as titles produced. Single diversely staged productions, whether diverse based on text or artistic vision, can strongly influence smaller subsets. The LORT analysis is representative of what we’ve discovered across all contracts.
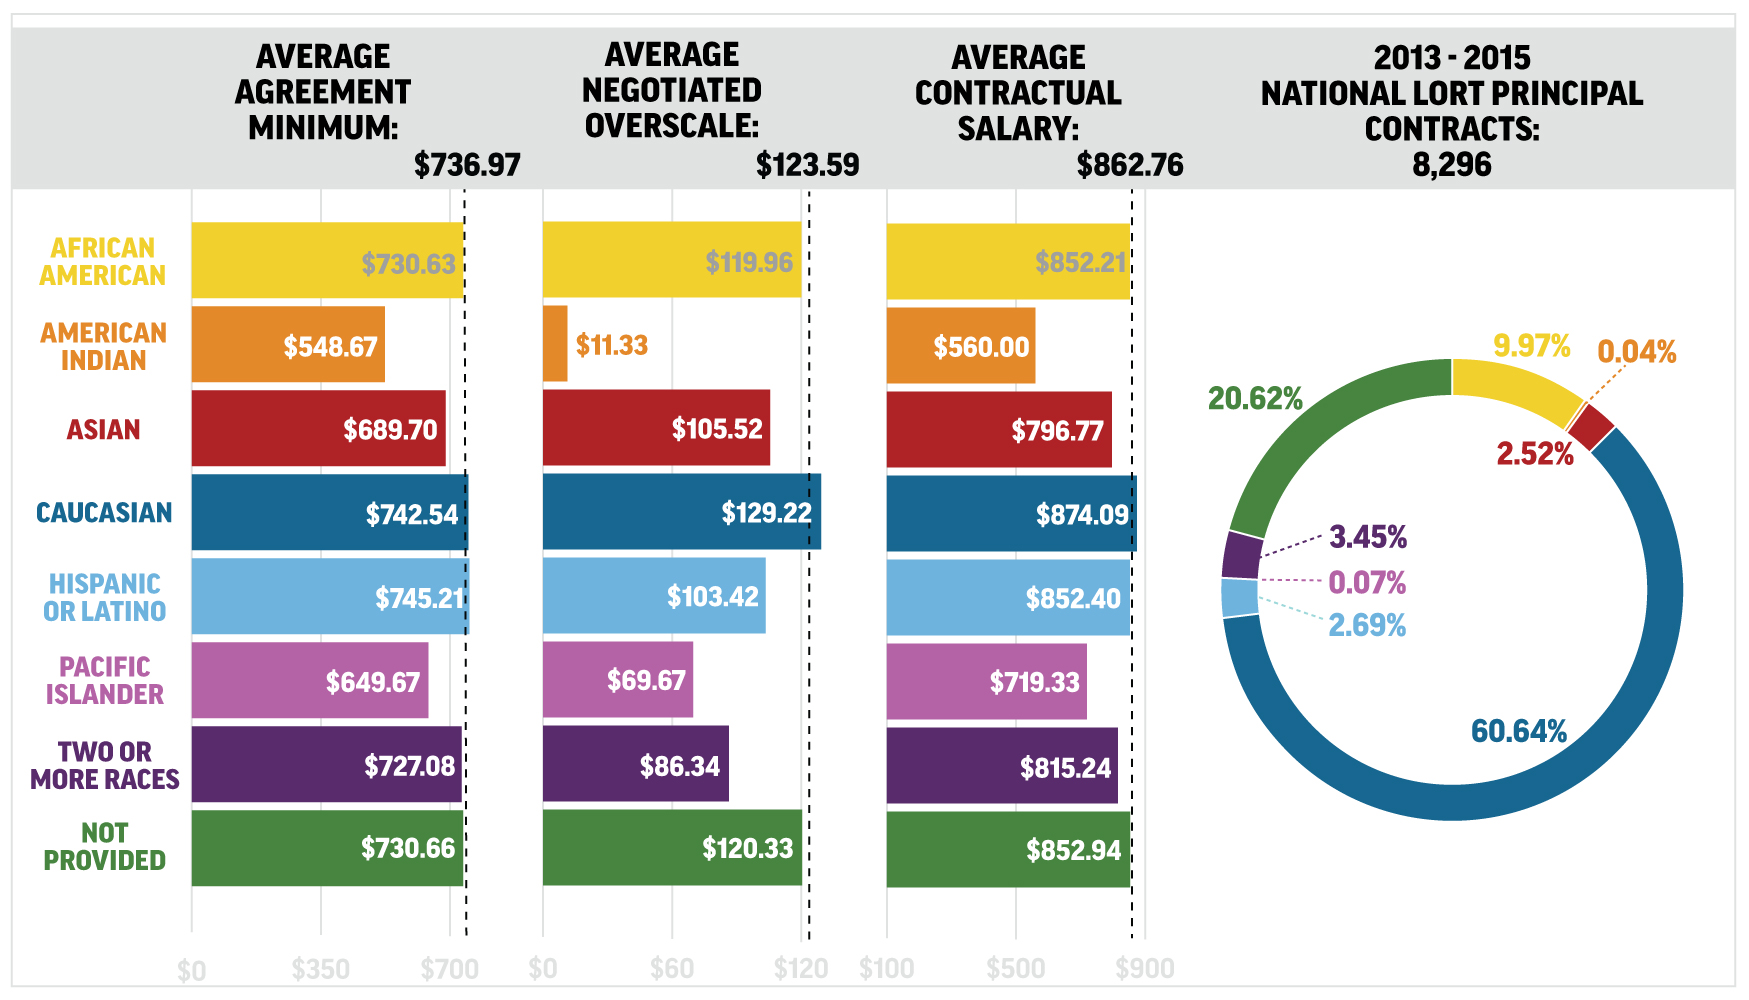
National LORT Principal in a Play Employment
Between 2013-15, there were 8,296 work opportunities under the LORT Agreement for principal actors in non-musical productions.
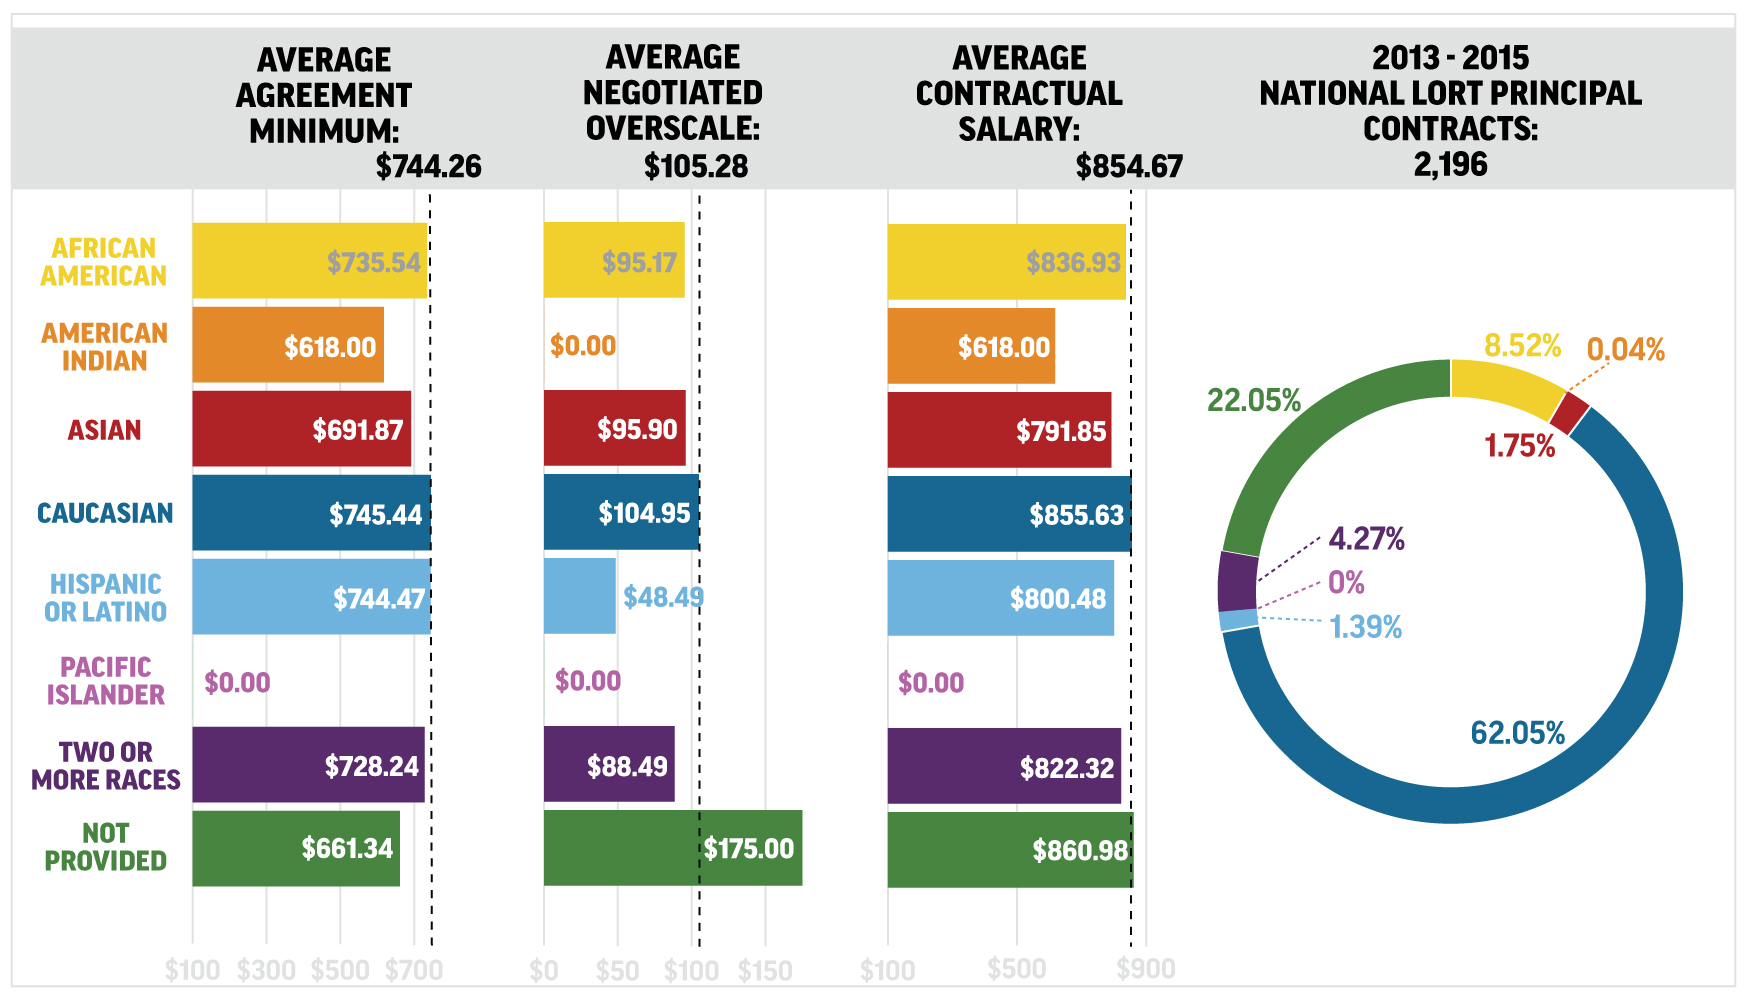
National LORT Principal in a Musical Employment
With a quarter of the contractual opportunities compared to non-musicals, there were 2,196 Principal LORT Contracts offered in musicals between 2013-15. Analyzing this employment by race/ethnicity:
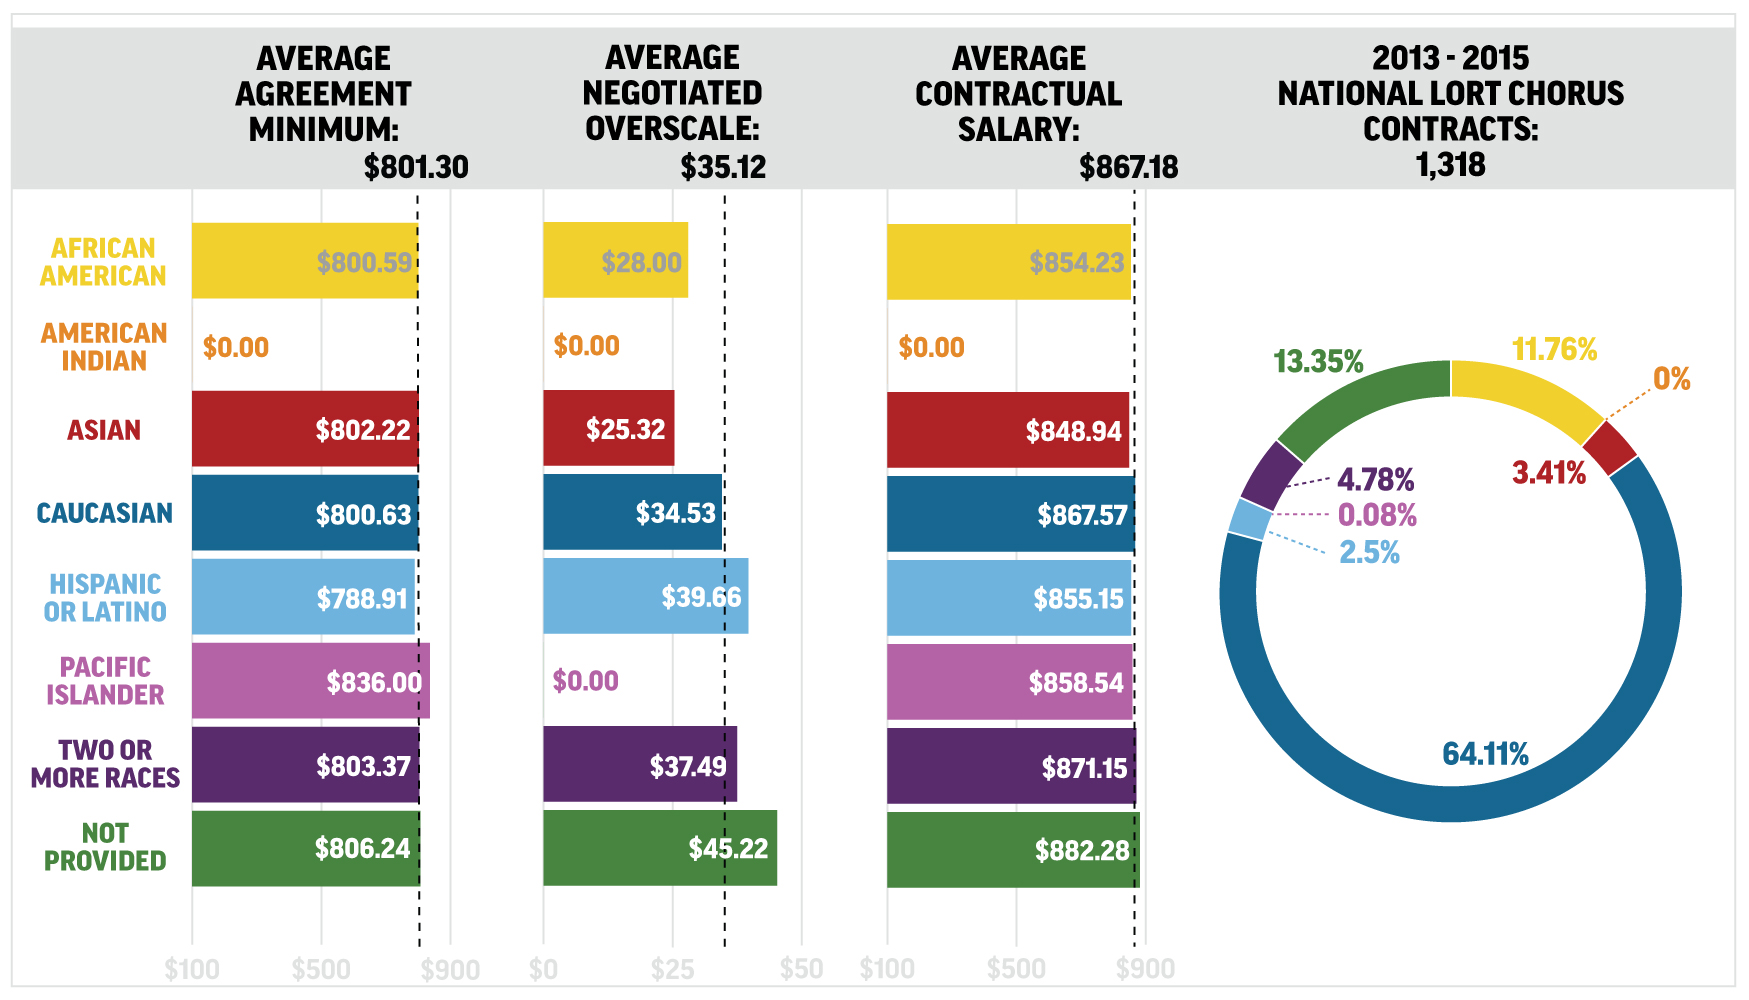
National LORT Chorus in a Musical Employment
There were 1,318 chorus work opportunities on LORT contracts during the three years of the study. Please note that the financial figures are higher than averages for Principals on LORT Musicals because chorus employment was, on average, at LORT theaters with higher categories and minimums.
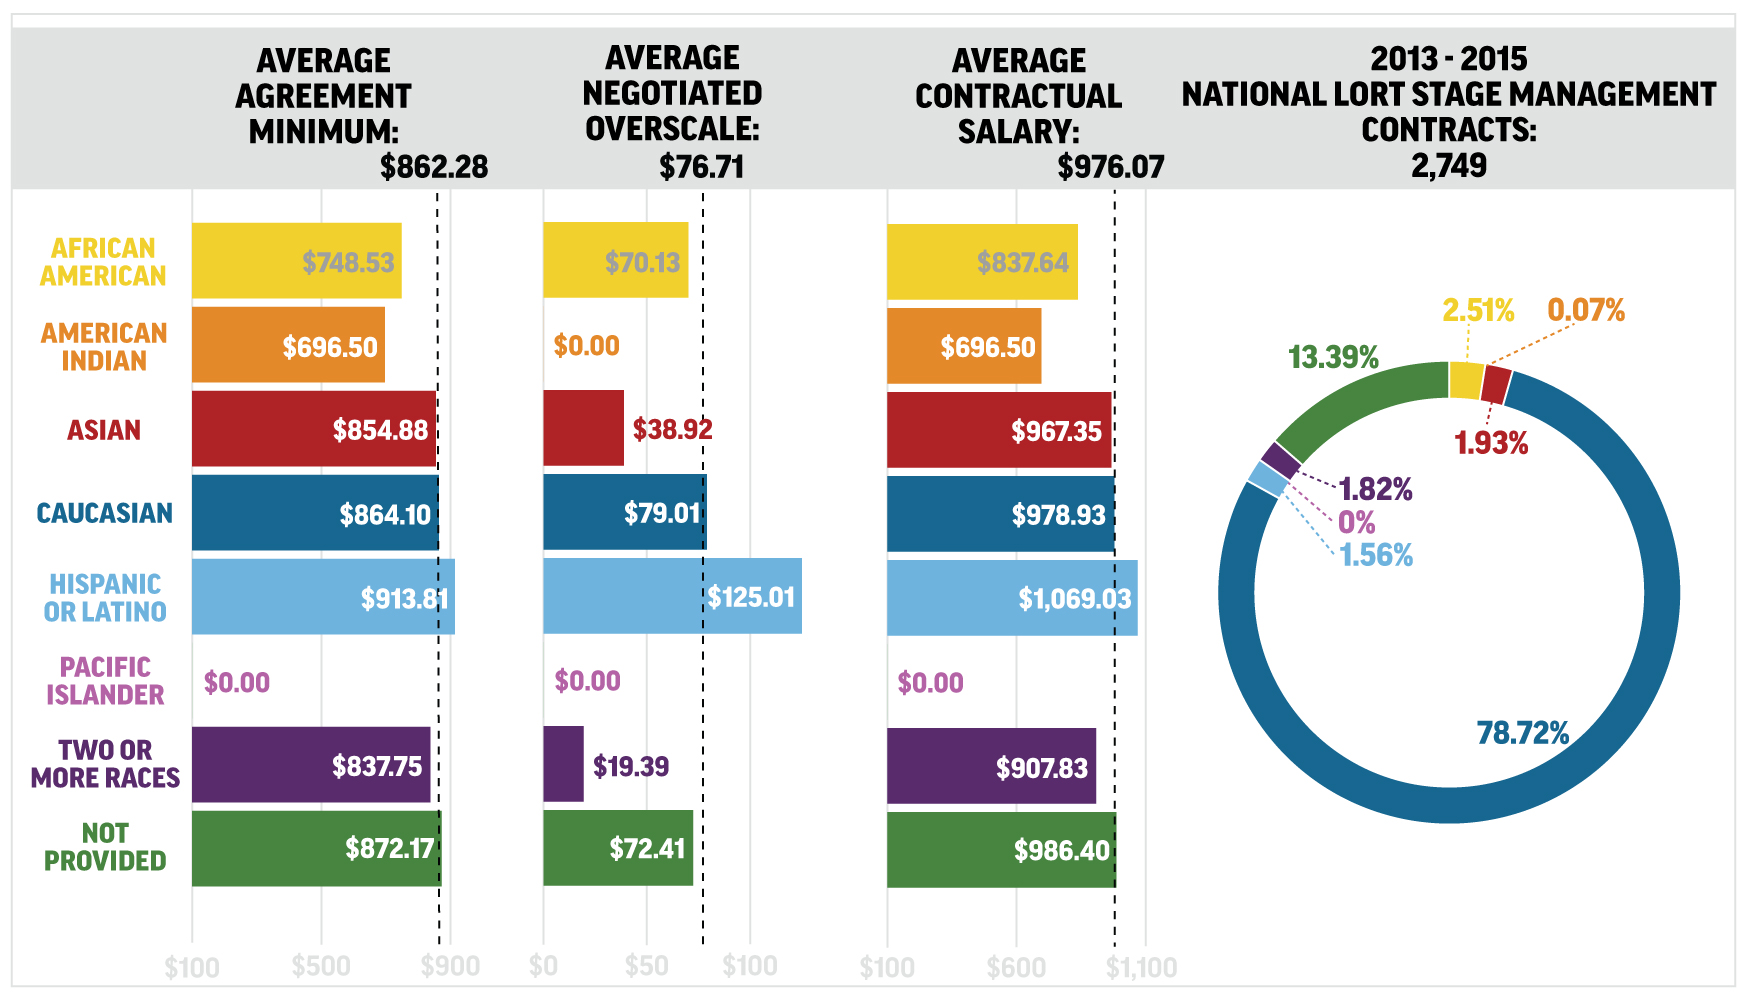
National LORT Stage Manager Employment
Between 2013-15, there were 2,749 stage management work opportunities, including assistant management, on LORT contracts.
Change The Stage
Consider this study our call to action. It’s time for us, as a union and as a leader within our community, to shine a light on the hiring practices within our industry. The numbers we’ve presented are unacceptable. We’ve now seen on a macro and micro level both gender and racial and ethnic disparity when it comes to who is getting contracts and what they are paid.
With this study in hand, we now have a powerful platform to demand positive, forward-thinking change and ask for others to help us lead the charge. We cannot solely rely on contractual language encouraging diverse hiring practices to fix this. It won’t work alone. It hasn’t worked. This is an industry epidemic that has roots in every aspect of professional theatre. This goes beyond actors and stage managers; we need partners who can help to not just change the stage, but rather to help change the industry.
For Equity, it starts with the members. It’s important that we have a fully-realized portrait of the over 50,000 artists who make up this union. For those who haven’t self-identified, help us by self-identifying in the Member Portal. Remember, your information is completely confidential and will never be shared with anyone—it’s for the union’s own internal purposes. We rely on you as much as you rely on us.
Stay informed and get active with us. Watch for emails, posts in the Member Portal and videos speaking to how Equity is taking on this very serious problem. If we send a petition, sign your name; if we ask for feedback, we want to hear from you.
Take this fight outside. Publicly, that is. Get social with this. Use #ChangeTheStage and let your followers and colleagues know that you support positive change within our industry. Now, together, we must stand up and in solidarity foster inclusion and promote diversity on and off stage.